
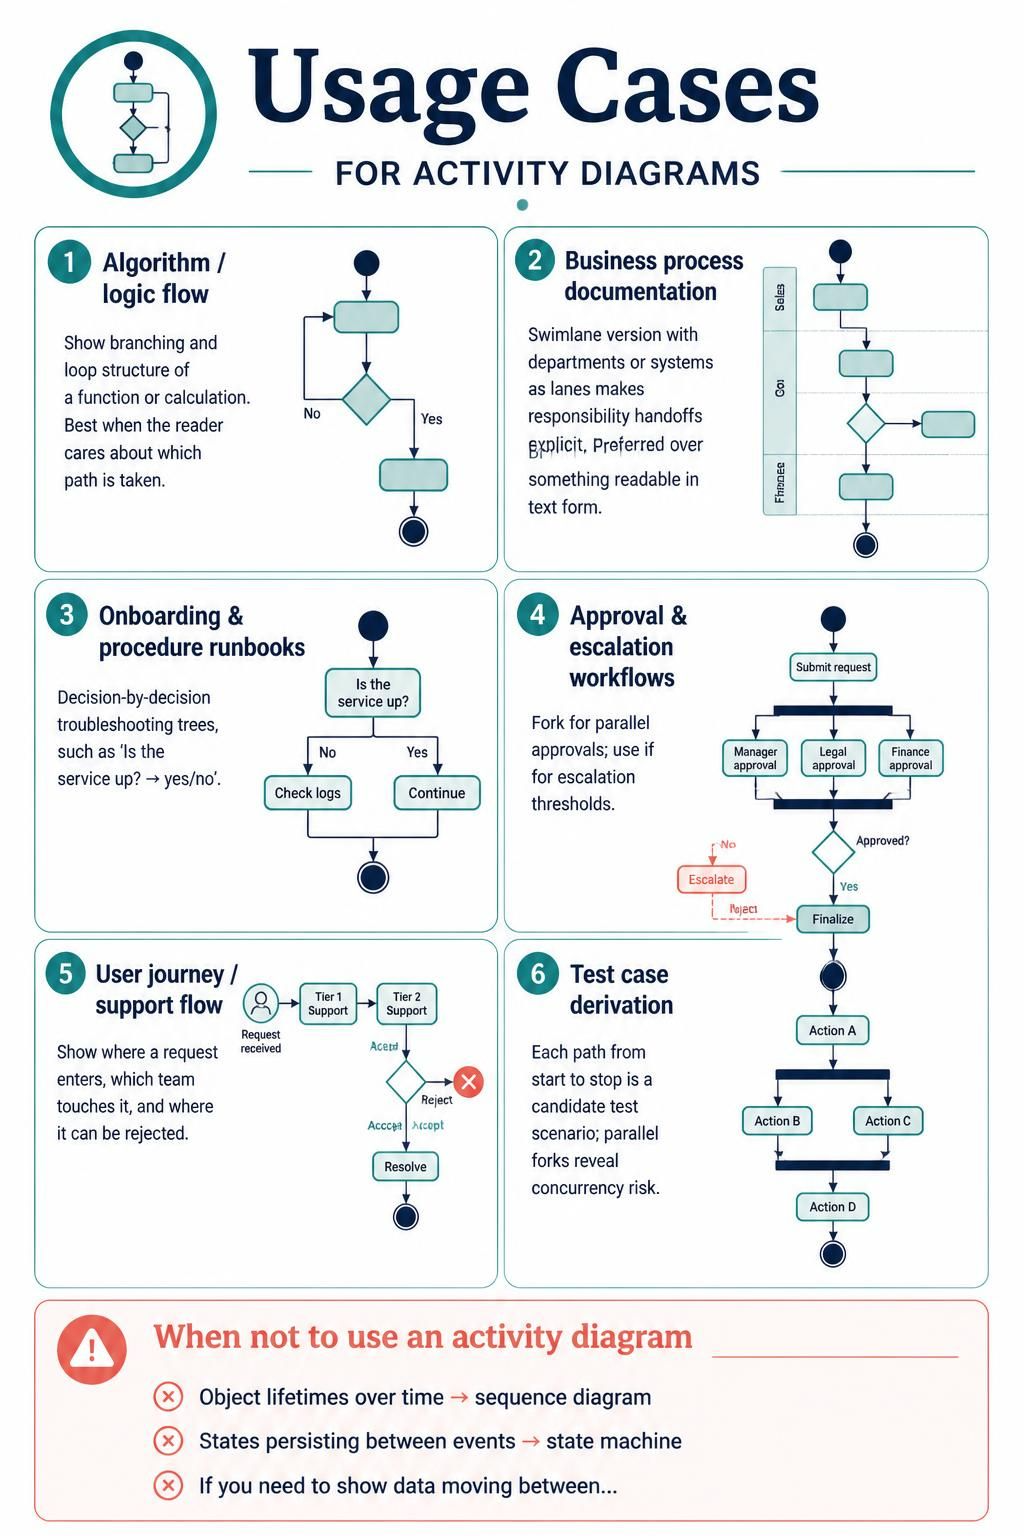
In the realm of software engineering and business analysis, clarity is king. One of the most versatile tools at your disposal for visualizing dynamic behavior is the Activity Diagram. Often referred to as the UML equivalent of a flowchart, activity diagrams excel at showing the flow of control from activity to activity. They are particularly powerful when you need to model complex logic, parallel processes, or user journeys.
This tutorial explores the specific usage cases for Activity Diagrams, moving from simple algorithmic logic to complex multi-departmental workflows. We will also examine when to avoid this notation in favor of sequence or state diagrams.
1. Modeling Algorithms and Logic Flows
The most fundamental use of an activity diagram is to visualize the control flow of an algorithm or a specific calculation. Unlike a static code snippet, an activity diagram provides a high-level view of which path is taken based on conditional logic.
Key Concepts:
- Branching: Using diamond shapes to represent decision points (e.g., “Is the value greater than 5?”).
- Looping: Flow lines that return to a previous step, creating a cycle until a condition is met.
flowchart TD
    Start([Start]) --> Process{Calculate}
    Process --> |Greater than 10| High([Set to High])
    Process --> |Less than 10| Low([Set to Low])
    High --> End([End])
    Low --> End
Best Practice: When modeling logic, ensure your reader can easily distinguish between the “Yes” and “No” paths. If a calculation is complex, consider breaking it down into sub-activities (swimlanes or nested diagrams) rather than cluttering a single screen with hundreds of decision diamonds.
2. Business Process Documentation
For enterprise-level modeling, a standard flowchart is often insufficient because it hides who is doing what. This is where the Swimlane version of an activity diagram shines.
The Power of Swimlanes
By dividing the diagram into horizontal or vertical lanes representing departments (e.g., Sales, Finance) or systems, you make responsibility handoffs explicit. This is often preferred over BPMN (Business Process Model and Notation) when you want a format that is highly readable in standard text editors or basic modeling tools.
graph TD
    subgraph Sales["Sales Department"]
        S1[Submit Order]
    end
    subgraph Finance["Finance Department"]
        F1[Verify Credit]
    end
    S1 --> F1
Why use this? It clearly delineates where a process stops for one team and begins for another, highlighting potential bottlenecks in communication or handoffs.
3. Onboarding and Procedure Runbooks
Operational teams rely heavily on decision-by-decision troubleshooting trees. These are essentially linear activity diagrams designed for “If-Then” logic during incident response or system onboarding.
Example Scenario
Imagine a technician troubleshooting a server outage. The diagram acts as a decision tree:
flowchart TD
    Start([Is Service Up?])
    Start -->|Yes| Continue[Continue Operations]
    Start -->|No| CheckLogs[Check System Logs]
    CheckLogs -->|Error Found| Restart[Restart Service]
    CheckLogs -->|No Error| Escalate[Escalate to Vendor]
This structure is ideal for runbooks because it guides the reader through a specific path to resolution without overwhelming them with unrelated system details.
4. Approval and Escalation Workflows
Complex business processes often require multiple stakeholders to sign off on a request. Activity diagrams are uniquely capable of handling concurrency and escalation.
Parallel Forks
When a request needs approval from a Manager, Legal, and Finance simultaneously, we use a Fork node. The process splits into parallel tracks that must all complete before the process can join again at a Join node.
flowchart TD
    Start([Submit Request])
    Start --> Fork1{{Fork}}
    Fork1 --> Manager[Manager Approval]
    Fork1 --> Legal[Legal Approval]
    Fork1 --> Finance[Finance Approval]
    Manager --> Join1{{Join}}
    Legal --> Join1
    Finance --> Join1
    Join1 --> Decision{Approved?}
    Decision -->|No| Escalate[Escalate]
    Decision -->|Yes| Finalize[Finalize]
5. User Journey and Support Flows
From a product management perspective, activity diagrams map the lifecycle of a user request. They show where a request enters the system, which teams touch it, and—crucially—where it can be rejected.
Key Visualization: Use a red “X” or distinct terminal node to represent a rejection point. This ensures stakeholders understand that not every user journey ends in success, and that is a valid, modeled outcome.
6. Test Case Derivation
One of the most underrated features of activity diagrams is their utility in software testing. Every distinct path from the start node to the end node represents a candidate test scenario.
Identifying Concurrency Risks
If your diagram contains parallel forks (as seen in the approval workflow), these are prime candidates for concurrency testing. You can derive test cases that verify if the system handles simultaneous approvals correctly, or if race conditions occur when multiple users act on the same object.
flowchart TD
    Start([Start])
    Start --> ActionA[Action A]
    ActionA --> Fork{{Fork}}
    Fork --> ActionB[Action B]
    Fork --> ActionC[Action C]
    ActionB --> Join{{Join}}
    ActionC --> Join
    Join --> ActionD[Action D]
Note: Each path from Start to End (e.g., Start → ActionA → ActionB → ActionD) is a unique test scenario.
When NOT to Use an Activity Diagram
While powerful, activity diagrams are not the silver bullet for every modeling problem. It is critical to choose the right tool for the job:
- Use Sequence Diagrams: If your primary goal is to show object lifetimes over time or the specific order of message exchanges between objects, a sequence diagram is superior.
- Use State Machine Diagrams: If you need to show states persisting between events (e.g., an Order transitioning from “Draft” to “Shipped” and staying “Shipped” until changed), a state machine is the correct choice.
- Use Data Flow Diagrams (DFD): If you need to show data moving between stores or data transformations across a system without focusing on control flow, a DFD is more appropriate.