
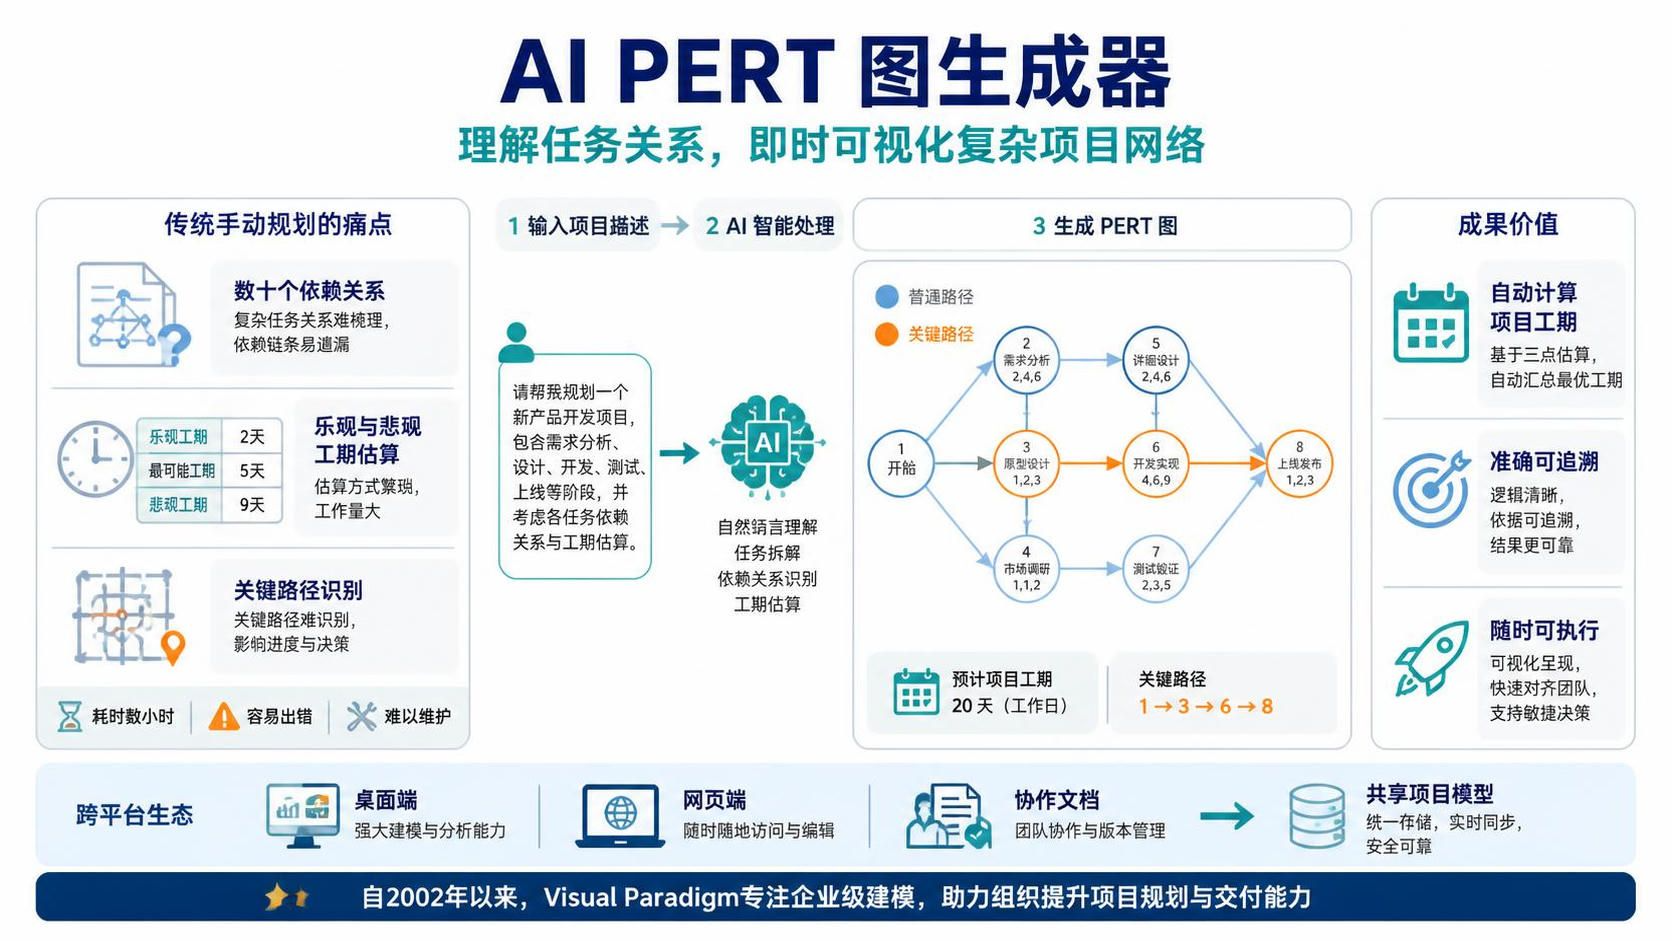
In the realm of modern project management, the creation of PERT (Program Evaluation and Review Technique) charts has historically been a daunting task. Manually mapping dozens of dependencies, estimating optimistic and pessimistic timeframes, and identifying the critical path requires hours of meticulous work. If you wish to automate project scheduling, you need a professional AI PERT chart generator that understands task relationships and instantly visualizes complex project networks.
This tutorial explores the system architecture and modeling concepts behind the AI PERT Chart Generator within Visual Paradigm. We will walk through the transition from manual planning pain points to an automated, AI-driven workflow that ensures your schedule is accurate, traceable, and actionable.
1. The Architecture of AI Scheduling
The system described in the diagram operates on a clear pipeline that transforms unstructured project requirements into structured network logic. This architecture is designed to bridge the gap between natural language descriptions and technical project management models.
The Workflow Pipeline
- Input Project Description: The process begins with the user providing a high-level description of the project scope in natural language.
- AI Intelligent Processing: The system utilizes Natural Language Processing (NLP) to parse the input. It performs three critical functions simultaneously:
- Task Breakdown: It decomposes the project into actionable sub-tasks.
- Dependency Inference: It automatically deduces logical relationships (e.g., Finish-to-Start) between tasks.
- Duration Estimation: It calculates timeframes based on the context provided.
- Generate PERT Chart: The system renders a visual network graph, highlighting the critical path and estimating the total project duration.
2. Core Modeling Concepts
To fully leverage this AI tool, one must understand the foundational concepts that the algorithm optimizes. The diagram highlights specific metrics and visual indicators used in this architecture.
PERT Analysis & Time Estimation
Unlike simple Gantt charts that rely on a single duration estimate, PERT charts utilize a probabilistic approach. The system analyzes three distinct timeframes for each task:
- Optimistic Duration (O): The shortest possible time to complete the task.
- Most Likely Duration (M): The realistic estimate under normal conditions.
- Pessimistic Duration (P): The longest time required if significant issues arise.
Visual Paradigm’s AI automatically aggregates these points to calculate the expected project duration, reducing the risk of underestimation.
The Critical Path Method (CPM)
The most vital output of this architecture is the identification of the Critical Path. This is the sequence of tasks that determines the shortest possible time to complete the project.
- Visual Indication: In the generated diagram, the critical path is highlighted (often in orange) to distinguish it from regular paths.
- Impact: Any delay in a task on this specific path will directly cause a delay in the entire project completion date.
- AI Advantage: The AI instantly calculates this path, removing the need for manual, error-prone forward and backward pass calculations.
3. Solving Traditional Pain Points
The diagram contrasts the manual method with the AI-driven approach, illustrating why automation is necessary for complex projects.
Dependency Mapping Challenges
Manually managing dozens of dependencies is prone to error. Dependencies are often missed, or the logic chains become tangled. The AI’s Automated Dependency Mapping capability infers relationships such as “Finish-to-Start” or “Start-to-Start” directly from the text, ensuring the network logic is robust.
Traceability & Integration
A key value proposition of the Visual Paradigm ecosystem is Traceability. The AI-generated PERT chart is not an isolated diagram. It can be linked to:
- Requirements Documents: Ensuring every task traces back to a business need.
- UML Models: Connecting high-level system design to project execution.
- BPMN Flows: Aligning technical processes with operational workflows.
4. Cross-Platform Ecosystem
Modern project management requires flexibility. The architecture supports a cross-platform environment, allowing the model to be:
- Desktop: Utilizing powerful local computing for complex modeling and analysis.
- Web: Enabling real-time viewing and editing from any browser.
- Collaborative: Sharing models for team coordination and version management.
Conclusion
The AI PERT Chart Generator represents a significant leap forward in project modeling. By automating the tedious aspects of dependency mapping and duration calculation, it allows project managers to focus on high-level strategy and risk management. With Visual Paradigm’s integrated AI ecosystem, your project schedules become accurate, traceable, and instantly actionable.