
In the modern landscape of technical documentation, static images are often a liability. Once a process changes, a screenshot becomes obsolete, leading to a disconnect between the documentation and the actual system. OpenDocs revolutionizes this workflow by allowing users to embed live, interactive diagrams directly into their documents. This tutorial explains the architecture behind this “Pipeline” integration and guides you through the process of embedding dynamic content.
The Problem with Static Screenshots
Traditional documentation relies heavily on “flat” screenshots. While effective for a snapshot in time, they suffer from three major limitations:
- Staleness: If a user updates the login flow or adds a new step, the screenshot in the document remains unchanged until manually replaced.
- Read-Only: Users cannot interact with the diagram to explore logic or understand the flow.
- Resolution Issues: Zooming into a screenshot often reveals pixelation, making small text or connection details unreadable.
OpenDocs solves this by utilizing the Pipeline ecosystem. Instead of embedding a raster image (like a .jpg), the system embeds a live data object. This ensures that the diagram in your document is always a “crisp,” interactive, and re-editable representation of the source model.
Step-by-Step: Embedding a Pipeline Diagram
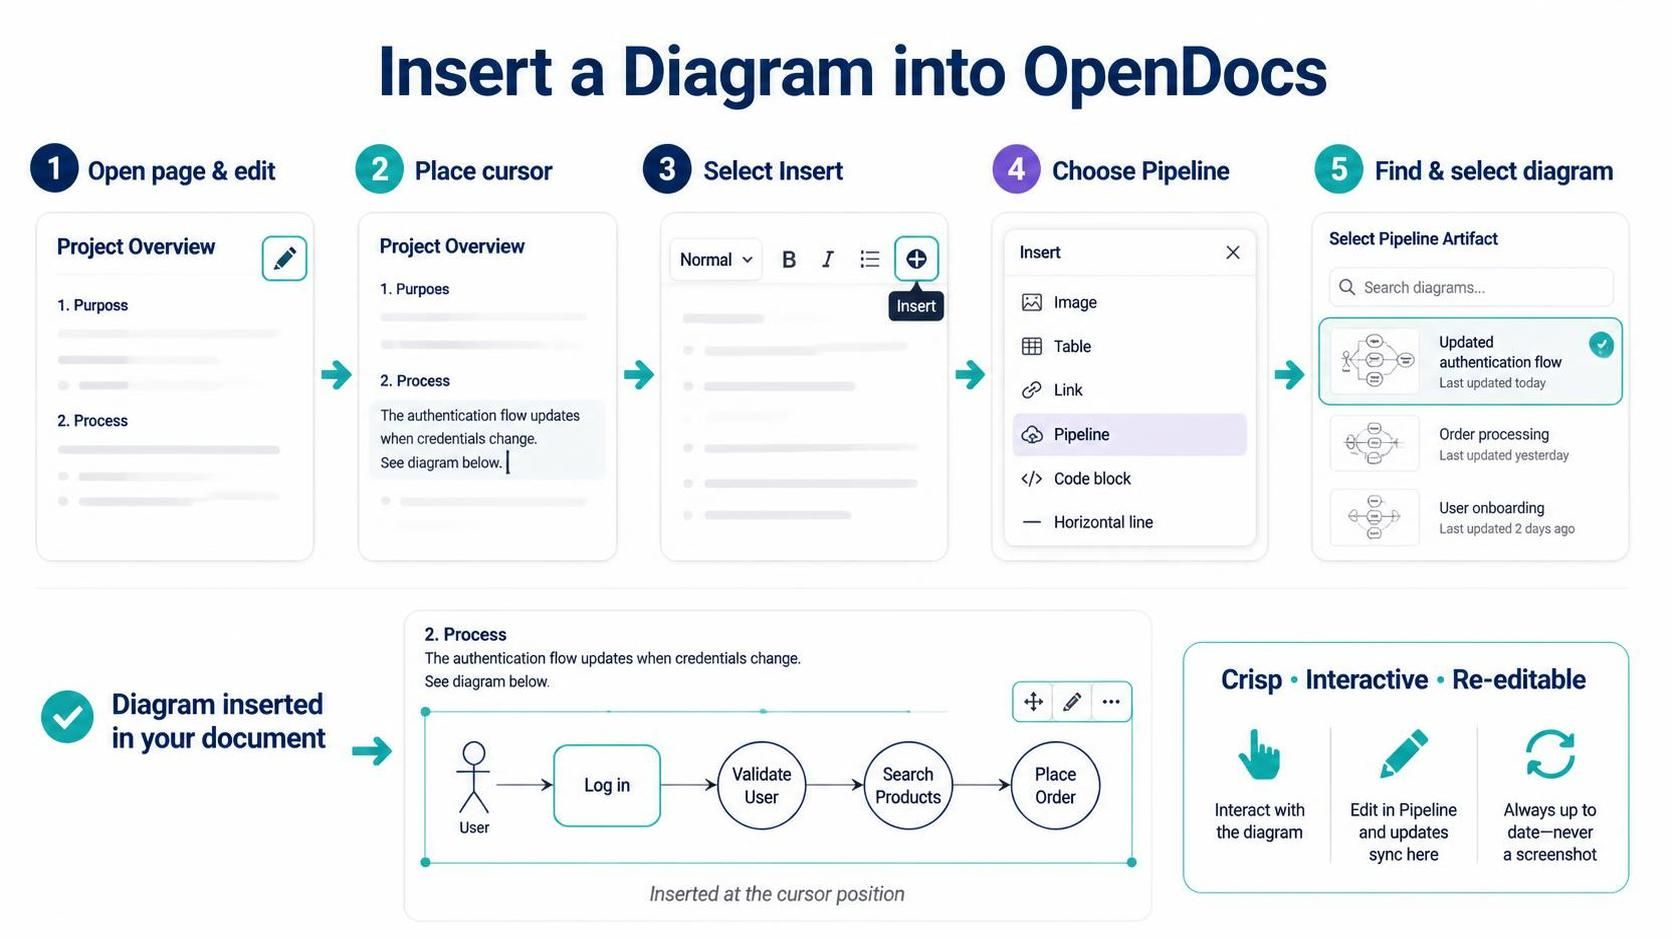
To integrate a diagram into an OpenDocs page, follow this structured workflow. The process is designed to be seamless, ensuring that the diagram appears exactly where your narrative flow requires it.
1. Open Page & Edit Mode
Navigate to the specific page in OpenDocs where you need the diagram. Click the Edit icon (usually a pencil) to enter the editing environment. This is crucial because the insertion tools are only available when you are actively composing content.
2. Place the Cursor
Position your text cursor at the exact insertion point. In the example of a “Process” overview, the cursor is placed below the introductory text, ready to receive the visual aid.
3. Select the Insert Tool
Locate the editor toolbar. Look for the Insert button (often represented by a plus sign + or a specific menu item). Clicking this opens a dropdown menu of available insertion types.
4. Choose “Pipeline”
This is the most critical step. In the insertion window, you will see options like “Image,” “Table,” and “Link.” Select Pipeline. This action signals the system that you are not looking for a generic file upload, but rather a dynamic object from the project’s architecture repository.
5. Find & Select the Diagram
A search interface will appear, displaying available artifacts such as “Updated authentication flow,” “Order processing,” or “User onboarding.”
- Use the search bar to filter by name or type.
- Click on the specific diagram card to select it.
6. Verify the Insertion
Once selected, the diagram is instantly rendered at the cursor position. Notice that the output is not a static image; it is a full-fledged interactive component.
Why “Crisp and Interactive” Matters
The diagram inserted via the Pipeline feature offers distinct advantages over standard image embedding:
- Interaction: Readers can hover over nodes to see details or click to navigate the flow.
- Editability: If the diagram needs an update, you edit it in the source Pipeline tool. The change automatically syncs to the OpenDocs page—no manual re-uploading required.
- Resolution Independence: Because it is vector-based or rendered from the source model, it remains “crisp” at any zoom level.
Conclusion
By mastering the “Insert Pipeline” workflow, you transform your documentation from a static archive into a living knowledge base. This approach ensures that your technical diagrams are always accurate, always interactive, and always up to date.